<%NUMBERING1%>.<%NUMBERING2%>.<%NUMBERING3%> PRTG Manual: PRTG Administration Tool on Core Server System
With the PRTG Administration Tool, you can define various system-oriented settings regarding your PRTG installation, restart services, and view log information. You can also change many of these settings via the system administration in the PRTG web interface.
 This section describes the available settings in the PRTG Administration Tool when you open the tool on the PRTG core server system. This means that you can edit settings that regard your PRTG core server or web server and the local probe, which is the probe on your PRTG core server. If you open the PRTG Administration Tool on a remote probe machine, only probe-related settings are available.
 Settings you define are only valid for the installation that runs on the computer on which you start the PRTG Administration Tool. To change settings for a different installation, for example, a different cluster node installation, log in to that computer and open the PRTG Administration Tool there.
 This feature is not available in PRTG hosted by Paessler.
Start the PRTG Administration Tool
From the Windows start menu, select the PRTG Network Monitor folder and click PRTG Administration Tool to open the application.
The PRTG Administration Tool has the following tabs:
After you change settings, click the Save & Close button. A new window opens where PRTG asks you to agree to restart the PRTG core server service. Click OK to proceed.

PRTG Administration Tool: Restart Services
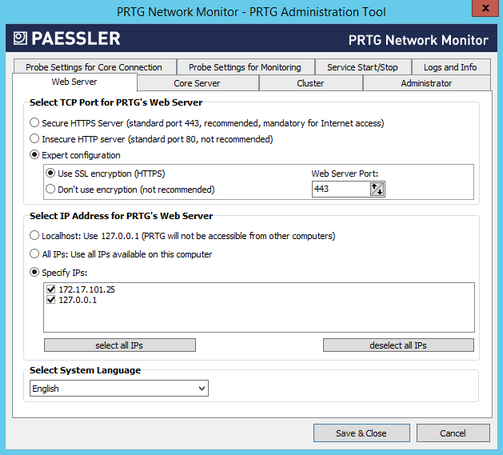
Web Server
Edit IPs, ports, access methods, and language for the PRTG web interface.
 You can also change all settings on the Web Server tab via the PRTG web interface in the User Interface settings.

PRTG Administration Tool
|
|
Select TCP Port for PRTG's Web Server
|
PRTG runs a web server to provide access via the web interface and PRTG Desktop. Specify on which port this web server runs:
- Secure HTTPS server (standard port 443, recommended, mandatory for internet access): We recommend this setting and you need it to access the PRTG server via the internet. Use a secure HTTPS connection that is encrypted via Secure Sockets Layer (SSL) on port 443.
 Although the connection is secure, you see an SSL Certificate Warning in your browser when logging in to the PRTG web interface because the default certificate is unknown to your browser. You can install another SSL certificate for PRTG later. For more information, see section Using Your Own SSL Certificate. Although the connection is secure, you see an SSL Certificate Warning in your browser when logging in to the PRTG web interface because the default certificate is unknown to your browser. You can install another SSL certificate for PRTG later. For more information, see section Using Your Own SSL Certificate.
 If port 80 is free, PRTG reserves it as well. If port 80 is not available, PRTG tries port 8080 as fallback. If this port is also not available, PRTG searches from port 8081 upwards for a free port. PRTG sends a ticket that shows you the currently used port number and switches back to 80 as soon as it is available again. When users try to connect on port 80 via HTTP, they are redirected to port 443 via HTTPS. You can change this behavior by using a registry setting. If port 443 is not available, PRTG tries port 8443 as fallback. If this port is also not available, PRTG searches from port 8444 upwards for a free port. PRTG sends a ticket that shows you the currently used port number and switches back to 443 as soon as it is available again. If port 80 is free, PRTG reserves it as well. If port 80 is not available, PRTG tries port 8080 as fallback. If this port is also not available, PRTG searches from port 8081 upwards for a free port. PRTG sends a ticket that shows you the currently used port number and switches back to 80 as soon as it is available again. When users try to connect on port 80 via HTTP, they are redirected to port 443 via HTTPS. You can change this behavior by using a registry setting. If port 443 is not available, PRTG tries port 8443 as fallback. If this port is also not available, PRTG searches from port 8444 upwards for a free port. PRTG sends a ticket that shows you the currently used port number and switches back to 443 as soon as it is available again.
- Insecure HTTP server (standard port 80, not recommended): Use a standard web server without SSL encryption on port 80. This setting is not recommended for WAN connections.
 If you use a web server that is not secure on the internet, attackers could potentially spy on credentials you enter into PRTG. We strongly recommend that you use this option in a LAN only. If you use a web server that is not secure on the internet, attackers could potentially spy on credentials you enter into PRTG. We strongly recommend that you use this option in a LAN only.
- Expert configuration: This setting allows you to specify a custom web server port and the security of the connection. This option is intended for systems with an existing web server on the standard port. Define the port and encryption below.
 If PRTG always uses a fallback port after a server restart, check for other programs that use the same port as PRTG. For example, the Microsoft Microsoft Internet Information Services (IIS) web server also uses port 80 (443 for SSL) by default and blocks it. Please disable such programs and services on startup. If PRTG always uses a fallback port after a server restart, check for other programs that use the same port as PRTG. For example, the Microsoft Microsoft Internet Information Services (IIS) web server also uses port 80 (443 for SSL) by default and blocks it. Please disable such programs and services on startup.
|
Expert Configuration: SSL Encryption
|
This field is only visible if you select Expert configuration above. Specify if you want to use a Secure Sockets Layer (SSL) encryption:
- Use SSL encryption (HTTPS)Use a secure HTTPS connection that is encrypted via SSL on a custom port as defined above.
 Although the connection is secure, you see an SSL Certificate Warning in your browser when you log in to the PRTG web interface, because the default certificate is unknown to your browser. You can install another SSL certificate for PRTG later. For more information, see Using Your Own SSL Certificate. Although the connection is secure, you see an SSL Certificate Warning in your browser when you log in to the PRTG web interface, because the default certificate is unknown to your browser. You can install another SSL certificate for PRTG later. For more information, see Using Your Own SSL Certificate.
- Don't use encryption (not recommended): This setting is not recommended for WAN connections. Use a standard web server without SSL encryption on a custom port as defined above.
 If you use a web server without encryption on the internet, attackers could potentially spy on credentials you enter into PRTG. We strongly recommend that you use this option in a LAN only. If you use a web server without encryption on the internet, attackers could potentially spy on credentials you enter into PRTG. We strongly recommend that you use this option in a LAN only.
|
Expert Configuration: Web Server Port
|
This field is only visible if you select Expert configuration above. Enter the TCP port number that you want the PRTG web server to run on. Enter an integer value.
 If you use a secure connection and port 80 is free, PRTG reserves it as well. When users try to connect on port 80 via HTTP, they are redirected to the custom port via HTTPS. You can change this behavior by using a registry setting. If you use a secure connection and port 80 is free, PRTG reserves it as well. When users try to connect on port 80 via HTTP, they are redirected to the custom port via HTTPS. You can change this behavior by using a registry setting.
 If the defined port for a secure connection is not available, PRTG tries port 8443 as fallback. If this port is also not available, PRTG searches from port 8444 upwards for a free port. PRTG sends a ticket that shows you the currently used port number and switches back to the original port as soon as it is available again. If the defined port for a secure connection is not available, PRTG tries port 8443 as fallback. If this port is also not available, PRTG searches from port 8444 upwards for a free port. PRTG sends a ticket that shows you the currently used port number and switches back to the original port as soon as it is available again.
|
Select IP Address for PRTG's Web Server
|
PRTG runs a web server to provide access via the web and Windows interface. Specify the IP address this web server runs on. Later, you can log in to PRTG by pointing your browser to the specified IP address.
Choose from:
- Localhost, 127.0.0.1 (PRTG is not accessible from other computers): Use 127.0.0.1 only. The PRTG web interface and PRTG Desktop are only accessible from the computer PRTG is installed on. Either the selected port or at least one port in the range from 8080 to 8089 has to be available on 127.0.0.1.
 If you run PRTG on localhost, do not use the DNS name http://localhost to log in to the web server, as this may considerably slow down the PRTG web interface. Use your local IP address or http://127.0.0.1 instead. If you run PRTG on localhost, do not use the DNS name http://localhost to log in to the web server, as this may considerably slow down the PRTG web interface. Use your local IP address or http://127.0.0.1 instead.
- All IPs available on this computer (recommended): Use all IP addresses available on this computer and enable access to the web server for all of these addresses. The Transmission Control Protocol (TCP) port selected below must be free on every available IP address.
- Specify IPs: Select specific IP addresses on which the PRTG web server runs. The list is specific to your system. Add a check mark in front of every IP address you want the PRTG web server to be available at. You can also select all addresses or cancel the selection by clicking the check box in the table header. Either the selected port or at least one port in the range from 8080 to 8089 has to be available on the specified IP address.
 Regardless of the selected setting above, one port in the range from 8080 to 8180 has to be available on the specified IP address so PRTG can create reports. The report engine tries to connect to the PRTG core server on one of these ports. Regardless of the selected setting above, one port in the range from 8080 to 8180 has to be available on the specified IP address so PRTG can create reports. The report engine tries to connect to the PRTG core server on one of these ports.
 If PRTG does not find a network card on startup, it switches the IP setting to Localhost. This setting remains even if a network card is available later on. If you disabled or removed the network card on the machine running the PRTG core server, check this setting again. If PRTG does not find a network card on startup, it switches the IP setting to Localhost. This setting remains even if a network card is available later on. If you disabled or removed the network card on the machine running the PRTG core server, check this setting again.
|
Select System Language
|
Select the system language from the dropdown list. The default is English. Depending on your installation, you may be able to choose other languages here. This setting defines the language of the PRTG web interface, as well as of the PRTG Administration Tool.
|
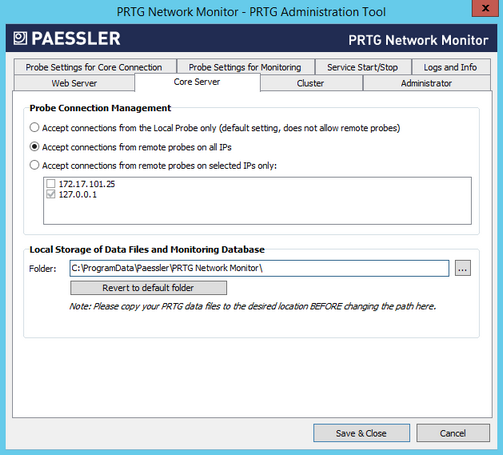
Core Server
Define settings for the PRTG core server.

PRTG Administration Tool: Core Server
|
|
Probe Connection Management
|
Define how PRTG handles incoming connections from probes:
- Accept connections from the Local Probe only (default setting, does not allow remote probes): This is the default setting. Only local probe connections are accepted by the PRTG core server. If you enable this setting, you cannot use remote probes.
- Accept connections from remote probes on all IPs: Incoming connections from remote probes are always accepted, no matter on which IP address of the PRTG core server they come in.
- Accept connections from remote probes on selected IPs only: Incoming connections from remote probes are only accepted on the selected IP address(es) of the PRTG core server. In the list, select the IP addresses by adding a check mark in front of the desired IPs.
You can also change this setting in the PRTG web interface under System Administration—Core & Probes.
|
Local Storage of Data Files and Monitoring Database
|
Select the directory where PRTG stores configuration and monitoring data. Click the ... button to choose a different folder on your system.
 Before you change the path, make sure you stop both the PRTG core server service and the PRTG probe service and copy all data to the new location. Before you change the path, make sure you stop both the PRTG core server service and the PRTG probe service and copy all data to the new location.
Click Revert to default folder to reset to default.
|
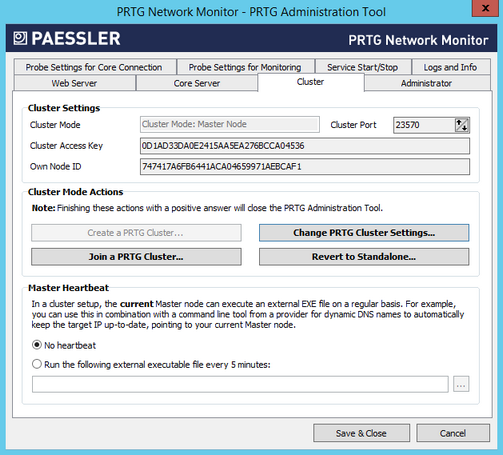
Cluster
On the Cluster tab, you can manually change how the current core installation behaves in a cluster. Before changing settings here, read section Failover Cluster Configuration.

PRTG Administration Tool: Cluster
|
|
Cluster Settings
|
Depending on the current cluster settings, you see different information here.
- Cluster Mode: Shows which cluster mode the current installation runs. This setting is shown for your information only and cannot be changed here. Possible values are Standalone (no cluster mode), Cluster Mode: Master Node, or Cluster Mode: Failover Node.
- Cluster Port: This field is only shown when PRTG runs in a cluster mode. This setting is shown for your information only and cannot be changed here.
- Cluster Access Key: This field is only shown when PRTG runs in a cluster mode. This setting is shown for your information only and cannot be changed here.
- Own Node ID: This field is only shown when PRTG runs in a cluster mode. This setting is shown for your information only and cannot be changed here.
|
Cluster Mode Actions
|
Depending on the current cluster settings, you see different active buttons here.
- Create a PRTG Cluster
- Join a PRTG Cluster
- Change PRTG Cluster Settings
- Revert to Standalone
 For details on these options, see below this table. For details on these options, see below this table.
|
Master Heartbeat
|
This section is only visible if you run your PRTG installation in cluster mode. The current master can execute an external executable file on a regular basis. We call this a "heartbeat".
You can use this, for example, to report the IP address of the current master node to a dynamic Domain Name System (DNS) provider, so a DNS name is always redirected to the current PRTG master node in case the original master node fails and a failover node (running at a different IP address) takes over the master role.
Choose between:
- No heartbeat: Do not execute a file on a regular basis.
- Run the following external executable file every 5 minutes: Click the ... button to select the file that you want to execute. This can be, for example, a command-line tool, or a batch file. It is executed on the current master node only, with a fixed interval of five minutes. The interval cannot be changed.
 Make sure that the selected file is available under the same (local) path on all failover nodes. In case one of your failover nodes becomes current master, the heartbeat can only be executed reliably if the executable file exists on all of your failover nodes. Make sure that the selected file is available under the same (local) path on all failover nodes. In case one of your failover nodes becomes current master, the heartbeat can only be executed reliably if the executable file exists on all of your failover nodes.
|
Cluster Mode Actions
Follow these instructions to create or join a cluster, to change a cluster's settings, or to revert a cluster node to a standalone PRTG installation:
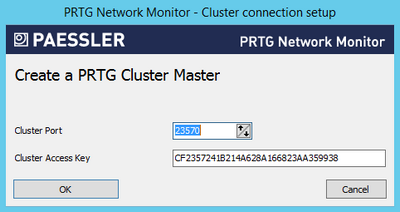
Create a PRTG Cluster
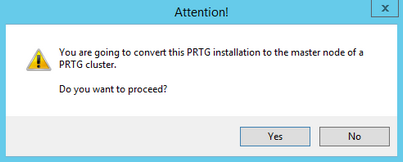
- Click this button to start creating a cluster. The current PRTG core server is then the Master Node of your cluster.
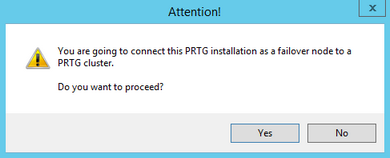
- Click Yes to confirm the conversion of this installation into a cluster master node.

Converting an Installation into a Cluster Master Node
- A new dialog box appears.

PRTG Administrator: Creating a Cluster Master
- Enter a Cluster Port. This is the port on which the internal communication between the different cluster nodes is sent. Make sure connections between cluster nodes are possible on the selected port.
- Enter or paste a Cluster Access Key. This is a unique access key. All nodes in a cluster have to be configured with the same cluster access key to join the cluster. Connection attempts with the wrong access key are rejected.
- We recommend that you use the default value.
- Save the Cluster Access Key so you have it at hand when configuring your Failover Nodes.
- After confirming your settings, you are asked to restart Windows services. Please do so for your changes to take effect.
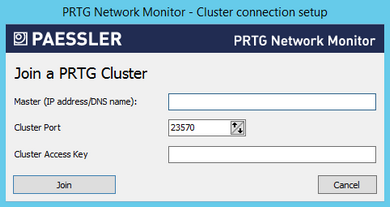
Join a PRTG Cluster
- Click this button to add this installation to an existing cluster that already has a master node. The current PRTG core server is then a failover node in the cluster.
- This button is also available if you are currently running your PRTG installation in Cluster Mode: Master Node. This option then changes your master node to a failover node.
- Click Yes to confirm the conversion of this installation into a failover node.

Converting an Installation into a Cluster Failover Node

PRTG Server Administrator
- Enter a Master IP address/DNS name for your cluster. It must be reachable from the machine running the failover node.
- Enter the other settings as defined in the settings of your master node. Make sure you use the same settings on all nodes in your cluster.
- Enter a Cluster Port. This is the port on which the internal communication between the different cluster nodes is sent. Make sure connections between cluster nodes are possible on the selected port.
- Enter or paste a Cluster Access Key. This is a unique access key. All nodes in a cluster have to be configured with the same cluster access key to join the cluster. Connection attempts with the wrong access key are rejected.
After confirming your settings, you are asked to restart Windows services. Please do so for your changes to take effect.
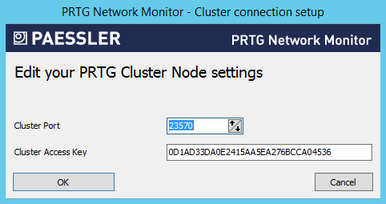
Change PRTG Cluster Settings

PRTG Server Administrator
- If you run your PRTG installation in cluster mode, you can change the settings here. A new window appears.
- Enter a Cluster Port. This is the port on which the internal communication between the different cluster nodes is sent. Make sure connections between cluster nodes are possible on the selected port.
- Enter or paste a Cluster Access Key. This is a unique access key. All nodes in a cluster have to be configured with the same cluster access key to join the cluster. Connection attempts with the wrong access key are rejected.
- Make sure that you use the same settings on all nodes in your cluster.
- After confirming your settings, you are asked to restart Windows services. Please do so for your changes to take effect.
Revert to Standalone
- If you run your PRTG installation in cluster mode, you can change it to Standalone mode. After doing so, this node is no longer part of a cluster.
- When you revert a PRTG installation to Standalone mode, the cluster probe remains in the device tree to keep your device and sensor setup. If you want to completely remove the cluster probe from the device tree, you need to delete it manually.
- After confirming your settings, you are asked to restart Windows services. Please do so for your changes to take effect.
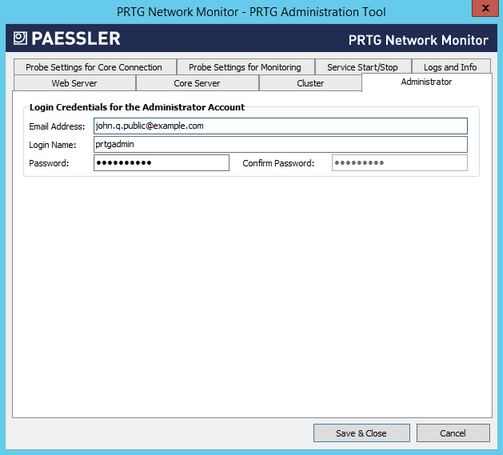
Administrator
On the Administrator tab, you can change settings for the PRTG System Administrator account.
 You can also change these settings in the account settings of the PRTG System Administrator user in the PRTG web interface.

PRTG Administration Tool: Administrator
|
|
Email Address
|
Enter a valid email address for the administrator. By default, PRTG sends notifications and important messages to this address.
|
Login Name
|
Enter a name for the PRTG System Administrator login. This is your default login! You use it when you log in to the PRTG web interface or PRTG Desktop.
 The default login name is prtgadmin. The default login name is prtgadmin.
|
Password
|
Enter a password for the PRTG System Administrator login. This is your default login! You use it when you log in to the PRTG web interface or PRTG Desktop.
 The default password is prtgadmin. The default password is prtgadmin.
|
Confirm Password
|
If you change your password, reenter the password for the PRTG System Administrator login to confirm it.
|
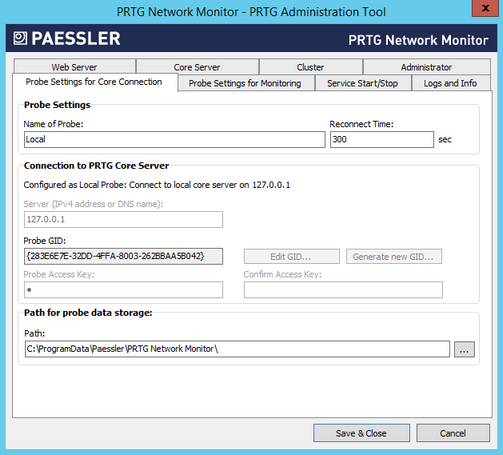
Probe Settings for Core Connection
Define general settings regarding the probe and probe connections.

PRTG Administration Tool: Probe Settings for Core Connection
|
|
Name of Probe
|
Enter a meaningful name to identify the probe. PRTG shows this name, for example, in the device tree, and in all alarms by default. Enter a string.
|
Reconnect Time
|
Define the time that PRTG waits until the probe tries to reconnect to the PRTG core server if the connection fails. Enter an integer value.
|
|
|
These settings affect the way the probe connects to the PRTG core server. A probe is either a local probe, a hosted probe, or a remote probe. PRTG automatically detects the type of probe and shows the correct setting options.
|
Server (IPv4 address or DNS name)
|
If this probe is configured as the Local Probe of the PRTG core installation, it connects to the core via 127.0.0.1, which you cannot change.
If this probe is configured as a Remote Probe, enter the IP address or Domain Name System (DNS) name of the PRTG core server.
|
Probe GID
|
The Probe GID is a unique identifier for the probe. You cannot change the GID on the PRTG core server system.
 Edit GID and Generate new GID are only available on the remote probe system. For more information, see section PRTG Administration Tool on Remote Probe Systems. Edit GID and Generate new GID are only available on the remote probe system. For more information, see section PRTG Administration Tool on Remote Probe Systems.
 You can deny GIDs under System Administration—Core & Probes in the PRTG web interface. If you remove a remote probe from the device tree or if you deny a remote probe after installation, its GID is automatically entered in the Deny GIDs list. You can deny GIDs under System Administration—Core & Probes in the PRTG web interface. If you remove a remote probe from the device tree or if you deny a remote probe after installation, its GID is automatically entered in the Deny GIDs list.
|
Probe Access Key
|
You do not need an access key for Local Probe connections.
On a Remote Probe, the Probe Access Key must match one of the access keys configured in your PRTG core server installation. If it does not match, the remote probe is not able to connect to the PRTG core server. See section System Administration—Core & Probes for more information.
 Check also allowed and denied IPs in System Administration—Core & Probes to ensure that the PRTG core server accepts the IP address of the remote probe. Check also allowed and denied IPs in System Administration—Core & Probes to ensure that the PRTG core server accepts the IP address of the remote probe.
|
Confirm Access Key
|
If you enter an access key for a remote probe, enter it in this field again to assure correctness.
|
|
|
Path
|
Select the directory where PRTG stores configuration and monitoring data. Click the ... button to choose a different folder on your system.
 Before you change the path, make sure you stop both the PRTG core server service and the PRTG probe service and copy all data to the new location. Before you change the path, make sure you stop both the PRTG core server service and the PRTG probe service and copy all data to the new location.
|
|
|
<your language>
|
Choose the language for the PRTG Administration Tool on your remote probe from the dropdown list. The default is English.
|
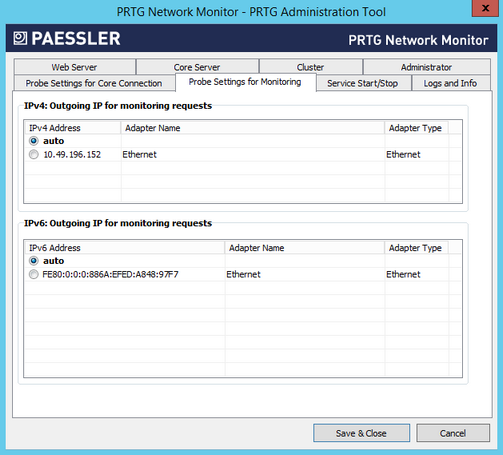
Probe Settings for Monitoring

PRTG Administration Tool: Probe Settings for Monitoring
|
|
Define the IP address used for outgoing monitoring requests.
- If more than one IP on the current system is available, you can specify the IP address that PRTG uses for outgoing monitoring requests of certain sensors.
- This setting is used for sensors that use the following connection types: HTTP, Domain Name System (DNS), File Transfer Protocol (FTP), Internet Message Access Protocol (IMAP), Post Office Protocol version 3 (POP3), Port, Remote Desktop, Simple Mail Transfer Protocol (SMTP), and Simple Network Management Protocol (SNMP).
- The setting is valid for all monitoring requests sent from this PRTG probe.
- This setting is useful for devices that expect a certain IP address when queried.
- The default setting is auto. PRTG selects an IP address automatically.
 This feature does not support all sensors for technical reasons. This feature does not support all sensors for technical reasons.
 If you change this setting, some sensors might stop working. For example, sensors might show a Down status if the selected IP address is blocked on the way to or directly on the monitored device. If you change this setting, some sensors might stop working. For example, sensors might show a Down status if the selected IP address is blocked on the way to or directly on the monitored device.
|
Outgoing IPv4
|
Define the IP address for outgoing requests using the IPv4 protocol. The list shows all IP addresses available on the current system. Choose a specific IP address or select auto.
|
Outgoing IPv6
|
Define the IP address for outgoing requests using the IPv6 protocol. The list shows all IP addresses available on the current system. Choose a specific IP address or select auto.
 For details about the basic concept of IPv6 in PRTG, see section IPv6. For details about the basic concept of IPv6 in PRTG, see section IPv6.
|
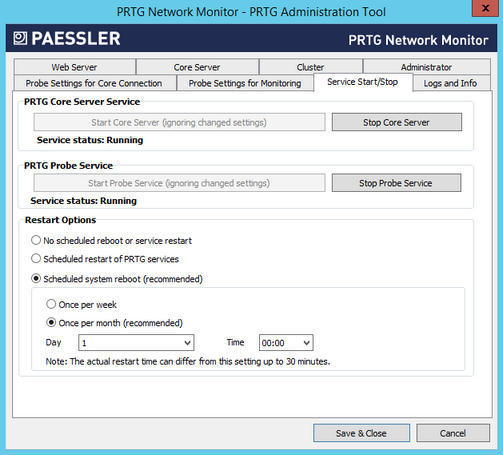
Service Start/Stop
You can stop and start PRTG Windows services manually. For connected probes, click Start Core Server to start the service or Stop Core Server to stop it. Both actions usually take from a few seconds up to several minutes to complete. You can also restart the PRTG core server and connected probes via the PRTG web interface under Administrative Tools.
 We recommend that you set a schedule for automatic system restarts.

PRTG Administration Tool: Start and Stop Service
You can also define a restart schedule on the Settings tab of a probe under Restart Options, in the PRTG web interface.
|
|
 This setting is not available on the Hosted Probe of a PRTG hosted by Paessler instance. This setting is not available on the Hosted Probe of a PRTG hosted by Paessler instance.
|
Restart Options
|
For best performance, we recommend that you regularly restart the Windows servers on which PRTG runs. Define if you want to schedule an automatic restart:
- No scheduled reboot or service restart: Do not perform a scheduled restart of services automatically. We recommend that you manually restart PRTG every few weeks. You can initiate a restart of your PRTG core server and probes under System Administration—Administrative Tools in the PRTG web interface.
- Scheduled restart of PRTG services: Restart all PRTG services on the system where this probe runs. If you select this option on the local probe, the PRTG core server restarts as well. Define a schedule under Restart Schedule.
- Scheduled system reboot (recommended): We recommend this setting although it is not the default setting. Define a schedule under Restart Schedule. We recommend that you restart Windows servers once a month for best performance.
|
Restart Schedule
|
This field is only visible if you select a schedule option above. Choose how often you want to restart PRTG services or the Windows server:
- Once per week: Select a day and a time below.
- Once per month (recommended): Select a day of the month and a time below.
|
Day
|
This field is only visible if you select a schedule option above. Select a day of the week (Monday to Sunday) or month (1st to 30th or Last). If you select Last, PRTG initiates the restart on the last day of the month, regardless of how many days the month has.
 If you select a date that does not exist in every month (for example, the 30th day in February), PRTG automatically initiates the restart on the last day of this month. If you select a date that does not exist in every month (for example, the 30th day in February), PRTG automatically initiates the restart on the last day of this month.
|
Time
|
This field is only visible if you select a schedule option above. Select the time of day when PRTG performs the restart.
 You get a Windows warning message 10 minutes before the restart to inform you if you are a currently logged in user. The actual restart time can differ by up to 30 minutes from the settings you enter here. You get a Windows warning message 10 minutes before the restart to inform you if you are a currently logged in user. The actual restart time can differ by up to 30 minutes from the settings you enter here.
|
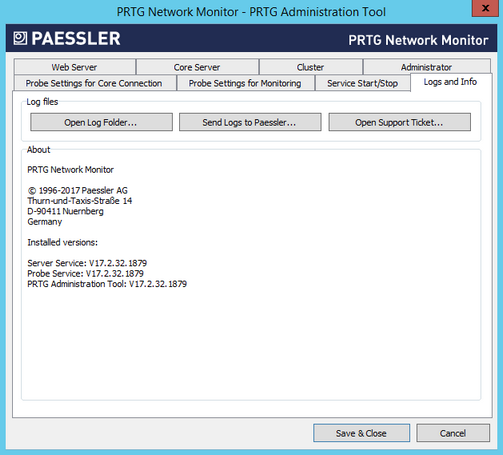
Logs and Info

PRTG Administration Tool: Logs and Info
|
|
Open Log Folder
|
Open the PRTG Network Monitor data directory on your hard disk drive to access all logfiles that PRTG creates.
|
Send Logs to Paessler
|
Open an assistant to send logfiles to the Paessler Support Team. See below for details.
 You can also send logfiles with the support bundle via Contact Support in the PRTG web interface. You can also send logfiles with the support bundle via Contact Support in the PRTG web interface.
|
Open Support Ticket
|
Open the support form on the Paessler website in a browser window.
 If you need help, we recommend that you use the Contact Support option in the PRTG web interface instead. If you need help, we recommend that you use the Contact Support option in the PRTG web interface instead.
|
The About section shows information about the version of installed PRTG programs and copyright.
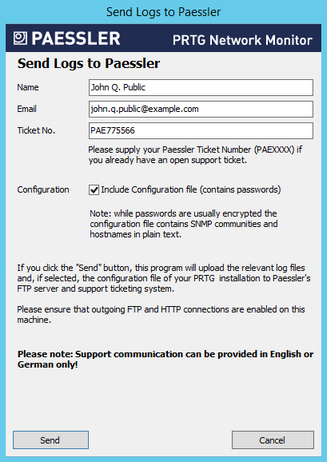
Send Logs to Paessler
 You can also send logfiles with the support bundle via Contact Support in the PRTG web interface.

Send Logs to Paessler
If you open a support ticket, Paessler Support might ask you to send logfiles for further analysis. With the Send Logs to Paessler button, PRTG automatically collects, compresses, and sends your logfiles to our FTP over SSL (FTPS) server.
|
|
Name
|
Enter your name.
|
Email
|
Enter a valid email address. You can provide any of your addresses, but we recommend that you use the email address of your PRTG account, which is entered by default.
|
Ticket No.
|
This field is optional. If you have already opened a ticket at Paessler Support, provide the ticket number you received. Your files are then associated with your ticket automatically.
Enter the ticket number starting with PAE followed by four or more digits, for example, PAE12345. If you do not have a ticket number, leave this field empty.
|
Configuration
|
Define if you want to include the configuration file in the data. PRTG will remove all passwords from the configuration file before sending it to our support team.
|
Click Send to start the data upload. Ensure that FTPS and HTTP connections are allowed on this machine.
More
PRTG Manual:
Knowledge Base: Which ports does PRTG use on my system?
PRTG Administration Tool—Topics


